
Baseline load
What each building draws when it is closed and empty. The cheapest saving in the portfolio and the easiest to ignore.

The point of measuring more than one building is comparison. Once every site reports the same way, the expensive ones stop hiding in an average.
What each building draws when it is closed and empty. The cheapest saving in the portfolio and the easiest to ignore.
The single largest controllable load across most commercial estates.
Schedulable centrally once the data shows the real occupancy hours.
Worth separating so recharges are based on measurement rather than floor area.

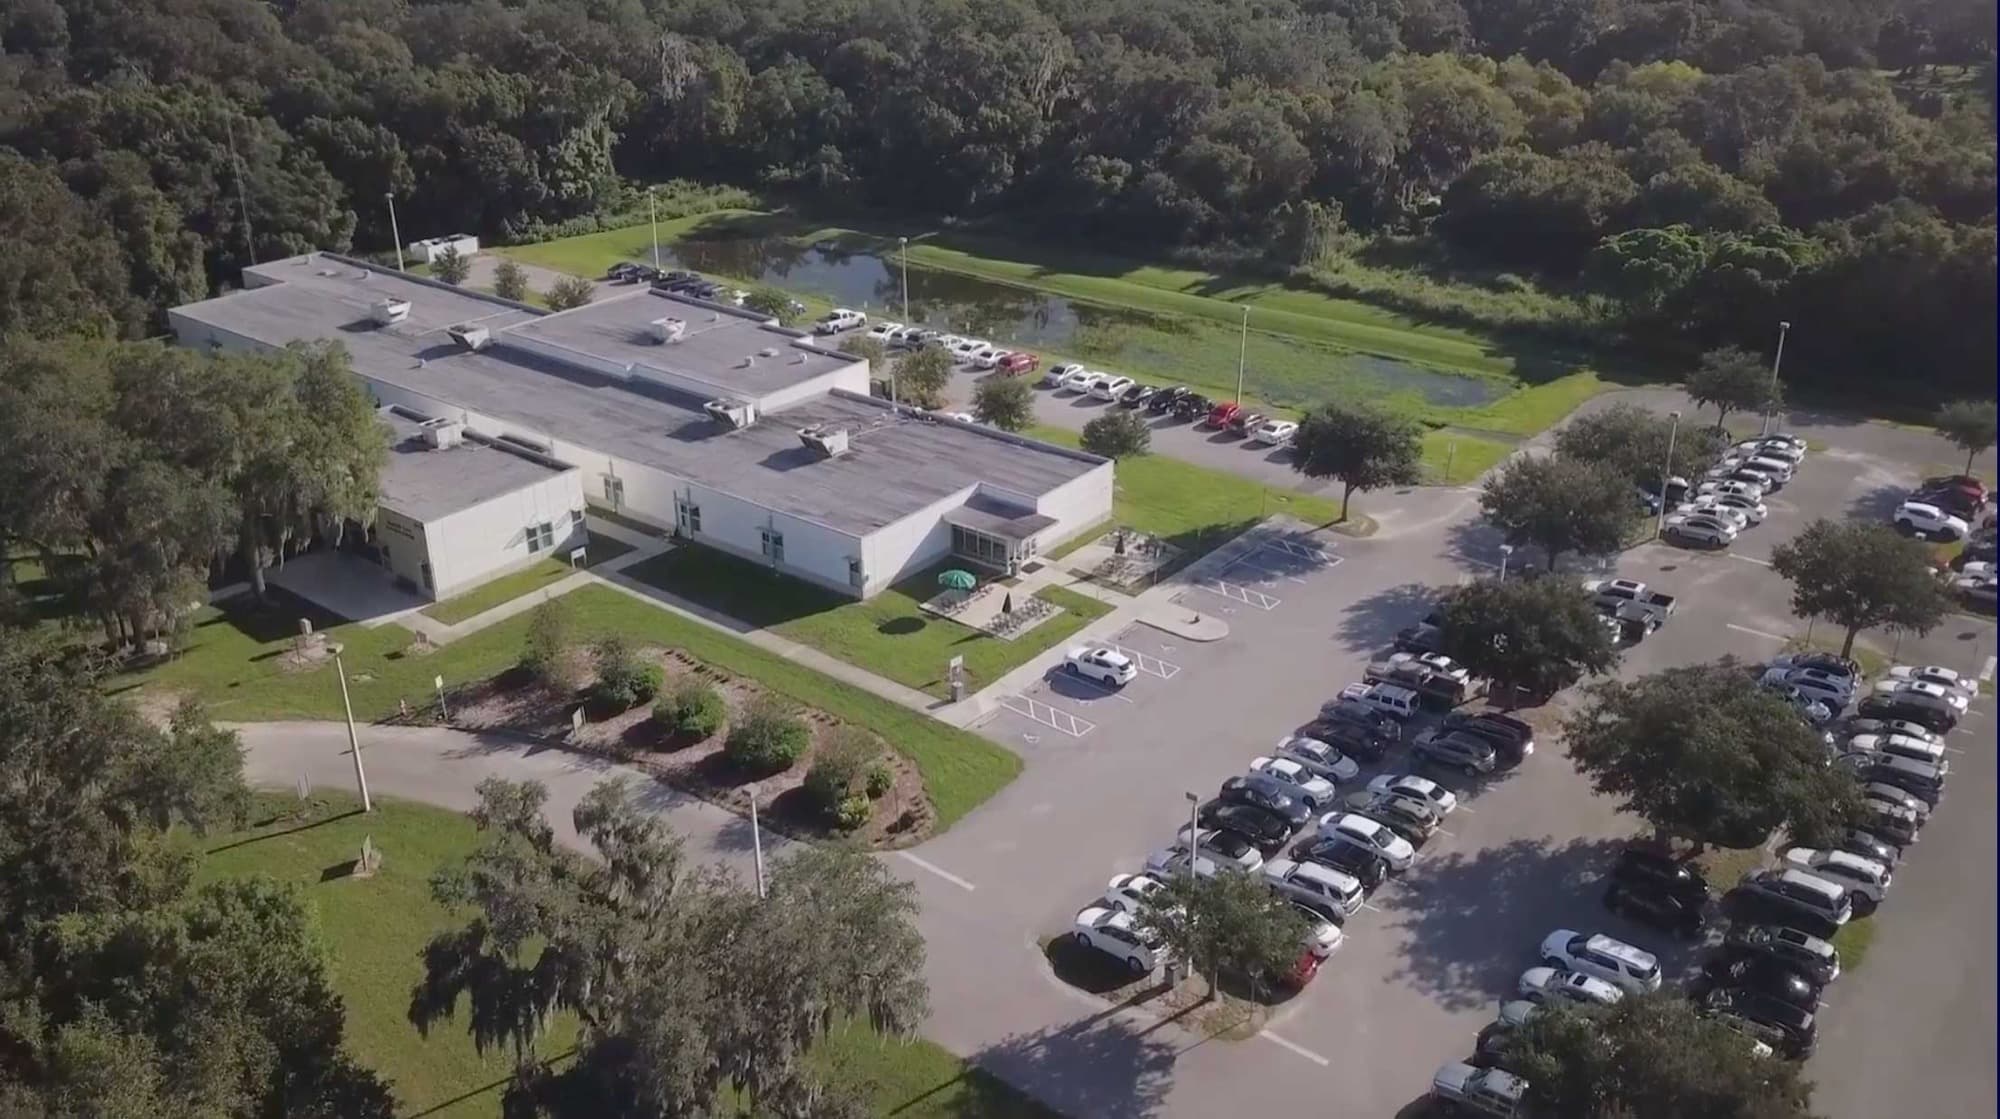
This is where managed energy earns its keep. Portfolios drift back without somebody watching the numbers every month.
Hotel groups, restaurant and pub groups, retail chains and any business running several buildings with one finance team paying the bills. The larger the portfolio, the more a single badly run site costs before anyone notices.
The same three parts, whatever the building.
 HardwareEniscope meters on the circuits that matter, reading every few seconds. Installed in a few hours, no shutdown.
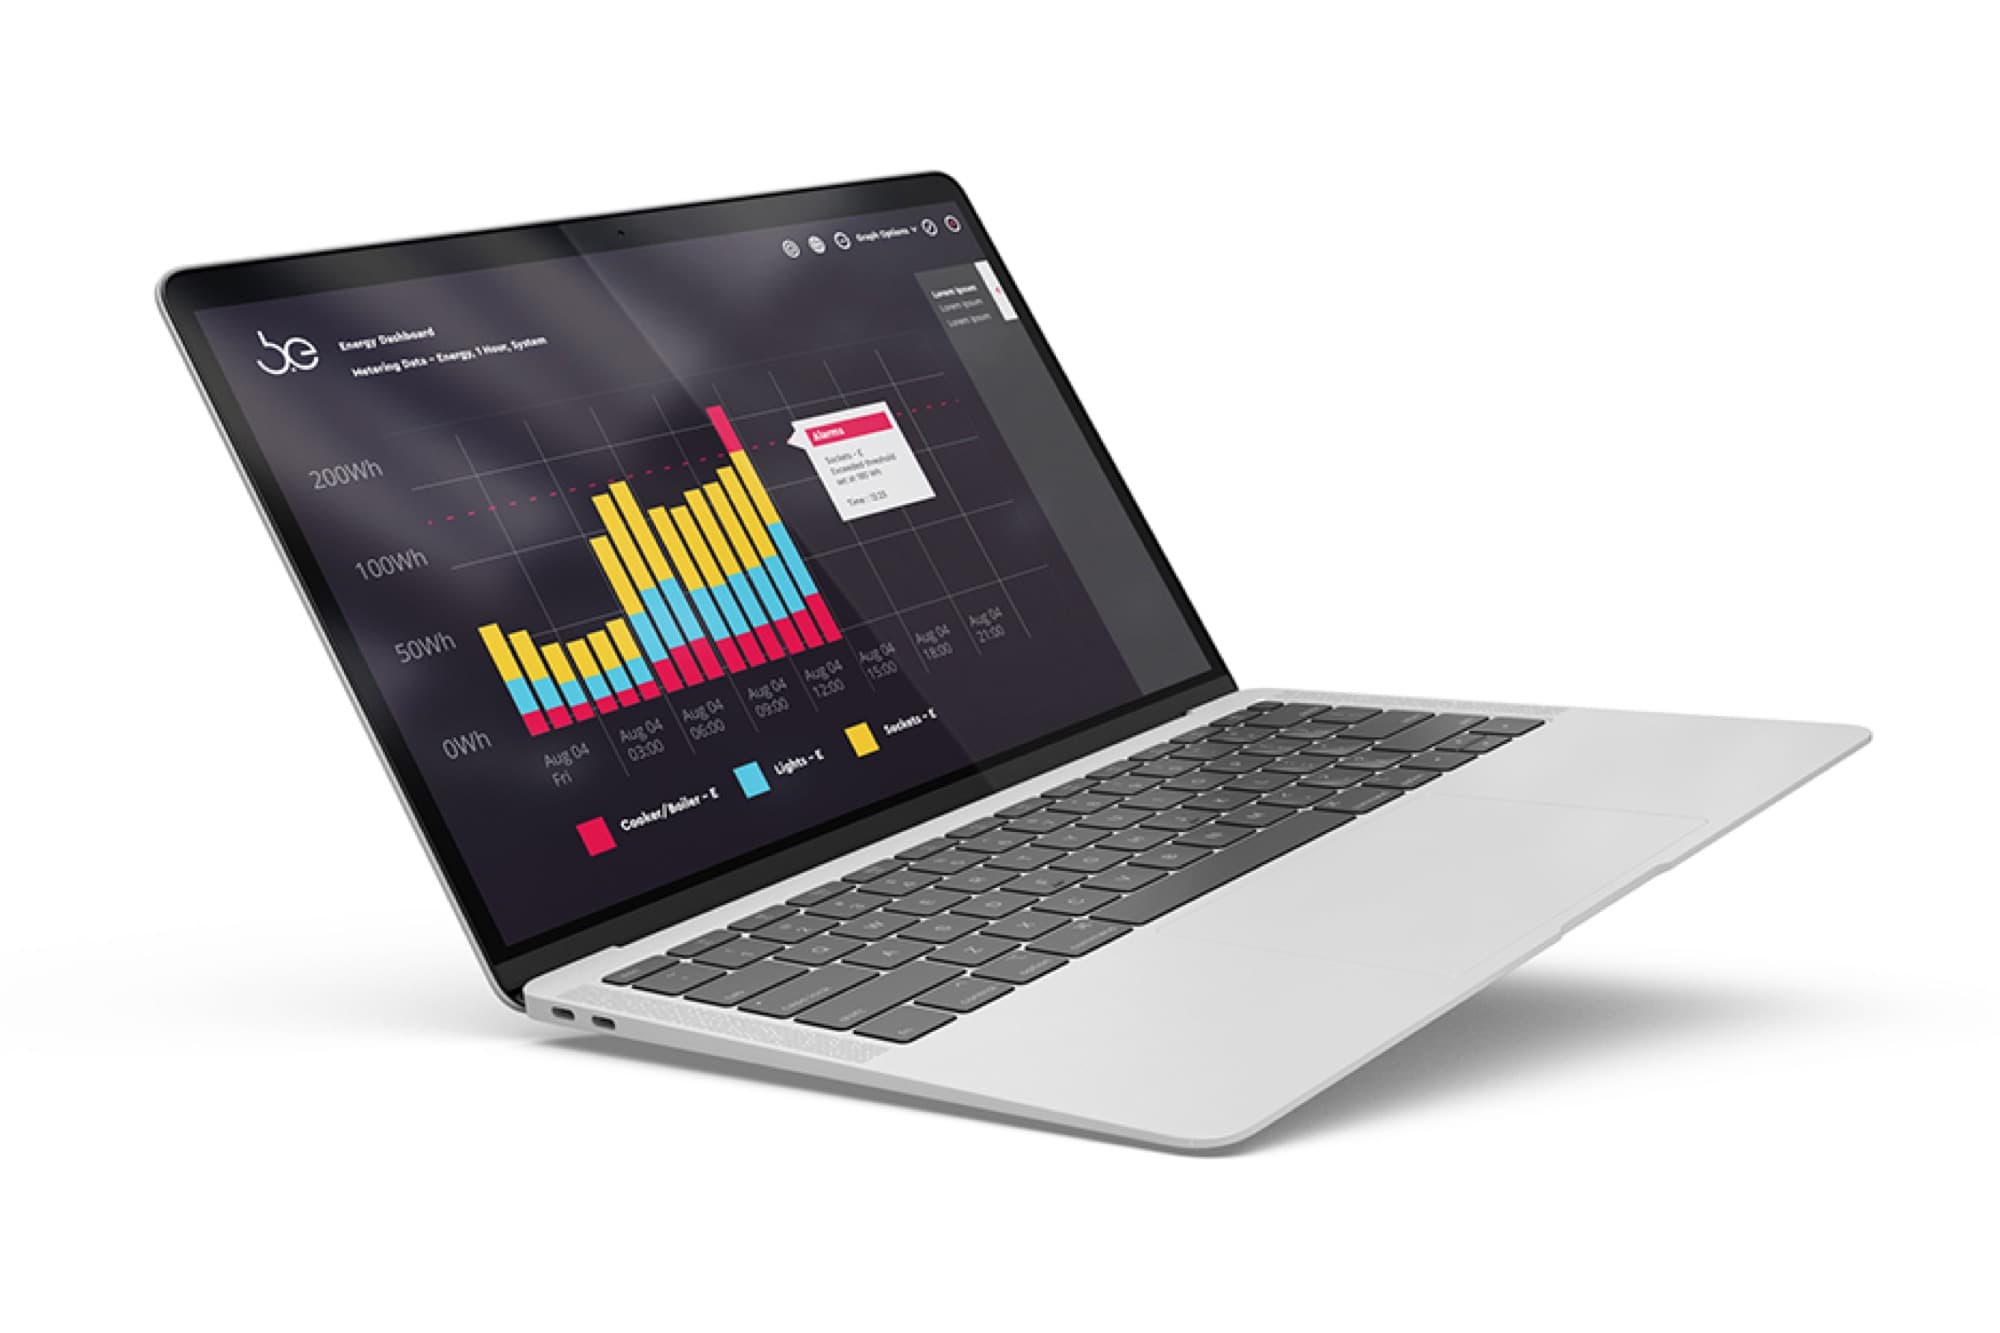 SoftwareA cloud dashboard showing use by asset, site and hour, with alerts when something changes.
 Our teamEnergy management from people who read the data every month and tell you what to do about it.
Measure every site the same way, then compare them on a fair basis such as energy per room, per cover or per square metre. The sites that use more than their peers show where to act first. Ongoing monitoring then catches drift before it adds up.
No. Many groups start with their largest sites or a single pilot, prove the savings, and roll out from there.
Head office sees every site in one view. Each site manager can see their own building. VisionGreen reviews the data monthly as part of energy management and reports the actions and results.
If you spend over €10,000 a year on energy, the Support Scheme for Energy Audits covers most of the cost. An engineer walks the site and writes up what to fix and what it returns.


